When working with geometric data, selecting the right tools for visualizing geometric data is crucial. Effective visualization helps in understanding complex structures and relationships within the data. In this article, I will introduce you to some of the best tools available for visualizing geometric data. we’ll also explain how these tools can enhance your analysis and improve your understanding of geometric concepts.
Understanding the Importance of Visualization
Visualization plays a significant role in scientific research, engineering, and data analysis. When we talk about tools for visualizing geometric data, we refer to software or applications that help represent shapes, structures, and their relationships visually. Such representations can make it easier to interpret data, identify patterns, and communicate findings to others. Now, let’s explore some of the best tools available for this purpose.
1. MATLAB
MATLAB is one of the most powerful tools for visualizing geometric data. It offers a wide range of built-in functions for plotting and creating 3D graphics. With MATLAB, you can easily manipulate matrices and visualize complex geometric structures. The ability to customize plots and add annotations makes it an excellent choice for researchers and engineers.
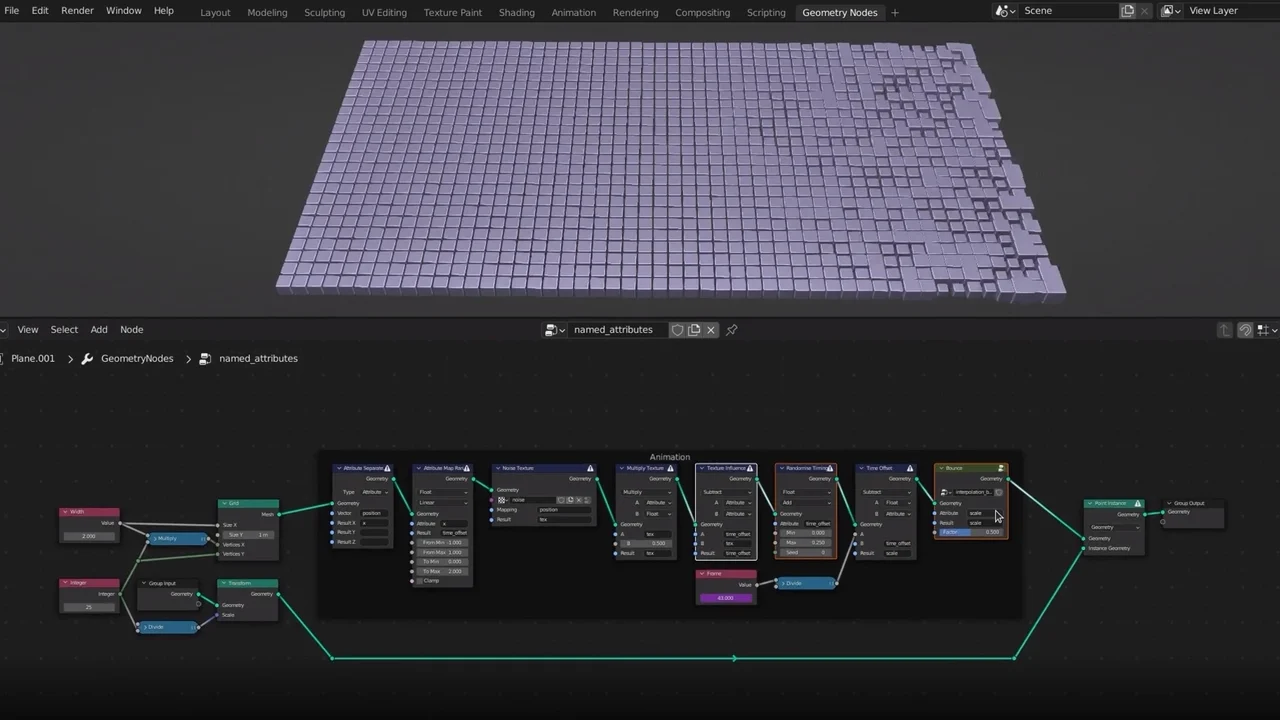
2. Blender
Blender is a popular open-source 3D modeling software that is highly effective for visualizing geometric data. It provides a robust set of tools for modeling, rendering, and animating geometric shapes. Whether you are working on architectural designs or complex simulations, Blender allows you to create detailed visualizations that can effectively convey your data.
3. GeoGebra
GeoGebra is an interactive geometry software that is ideal for education and research. It combines geometry, algebra, and calculus in a single platform, making it a versatile tool for visualizing geometric data. With GeoGebra, users can create dynamic geometric constructions and visualize mathematical relationships, making it an excellent choice for teachers and students alike.
4. Python with Matplotlib and Seaborn
Python is a powerful programming language, and when paired with libraries like Matplotlib and Seaborn, it becomes a fantastic tool for visualizing geometric data. Matplotlib allows for the creation of static, interactive, and animated plots, while Seaborn builds on Matplotlib to provide a higher-level interface for drawing attractive statistical graphics. This combination makes Python a great choice for data analysis and visualization.
5. Autodesk Fusion 360
Autodesk Fusion 360 is a cloud-based 3D CAD tool that excels in visualizing geometric data related to product design and engineering. It offers advanced modeling capabilities, allowing users to create, test, and iterate on designs in a collaborative environment. The ability to visualize complex assemblies and conduct simulations makes it an essential tool for engineers and designers.
6. Wolfram Alpha
Wolfram Alpha is a computational knowledge engine that can also serve as a tool for visualizing geometric data. By inputting equations or geometric definitions, users can generate visual representations of mathematical concepts. This tool is particularly useful for those looking to quickly visualize mathematical relationships without extensive programming knowledge.
7. SketchUp
SketchUp is a user-friendly 3D modeling tool that is widely used in architecture and design. It offers intuitive controls for creating and visualizing geometric data in three dimensions. Users can easily construct models, visualize designs, and share their work with others. SketchUp’s straightforward interface makes it accessible for beginners and professionals alike.
8. ParaView
ParaView is an open-source data analysis and visualization application that is particularly useful for large-scale data sets. It provides powerful tools for visualizing complex geometric data and is often used in scientific computing. With its ability to handle big data and perform parallel processing, ParaView is a valuable tool for researchers in fields like physics and engineering.
9. D3.js
D3.js is a JavaScript library for producing dynamic, interactive data visualizations in web browsers. While it requires some programming knowledge, D3.js allows for the creation of complex geometric visualizations that can be easily shared online. This makes it an excellent choice for web developers and data scientists looking to create engaging visual content.
10. R with ggplot2
R is a programming language that is widely used for statistical analysis, and the ggplot2 package is one of its most popular tools for visualizing geometric data. ggplot2 allows users to create visually appealing graphics using a coherent grammar of graphics. This tool is particularly useful for researchers looking to present their data in a clear and informative manner.
Conclusion
In conclusion, the right tools for visualizing geometric data can significantly enhance your understanding and communication of complex concepts. From MATLAB and Blender to Python with Matplotlib and R with ggplot2, each tool offers unique features suited to different needs. By choosing the appropriate software, you can effectively analyze and present your geometric data, leading to better insights and more informed decisions.